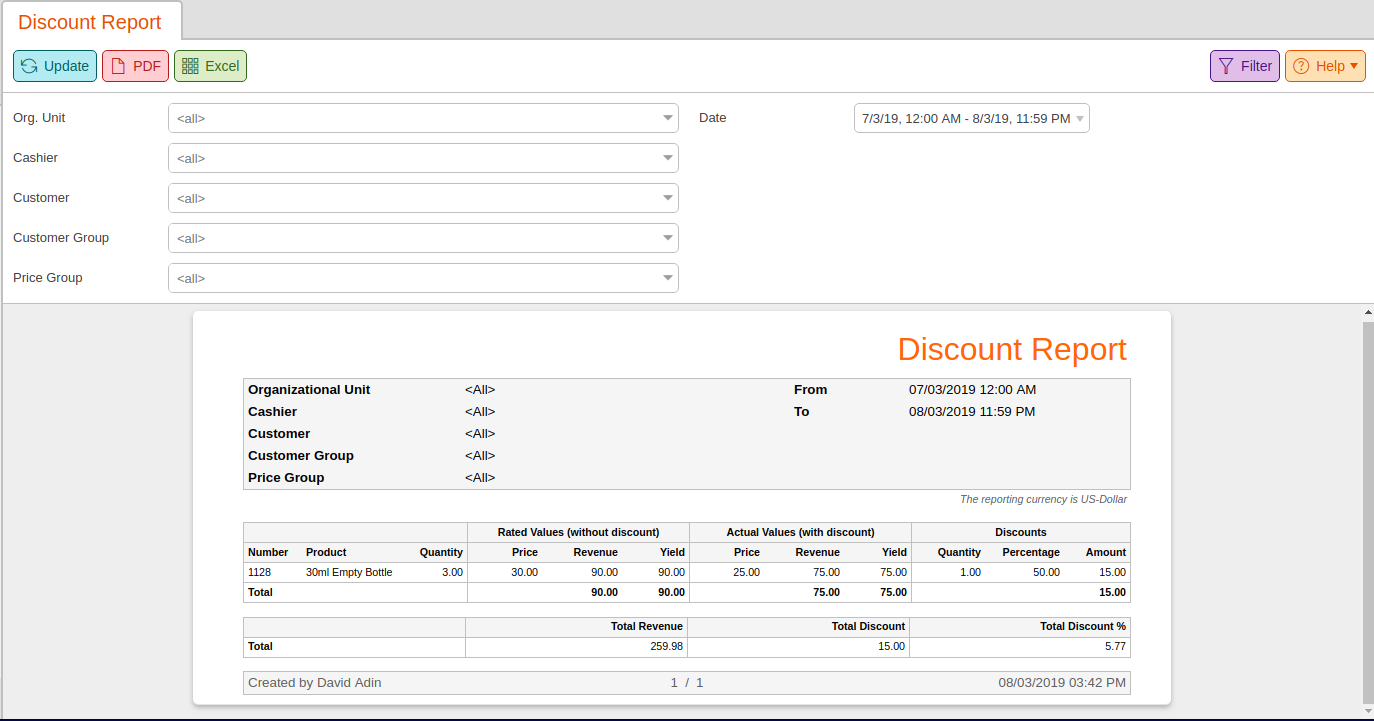
The Discount Report gives you an overview of how discounts affect your sales. This report focuses on discounted amounts and not as much on what actually caused the discount. For a more thorough examination of why discounts occur, refer to the Discount Reasons Report.
The Discount Report can be found under the Evaluations tab. If you cannot locate it there, you must Edit Menu Entries.
The report is filterable by Organizational Unit, Cashier, Customer, Customer Group, Price Group, and Date. Once you have chosen all of the desired filters, click on Update to refresh your results.
On the report listed will be the products’ names and numbers, along with the Price avg., Revenue, and Yield for Rated Values and Actual Values. Moreover, Quantity, Percentage, and Amount are listed for Discounts.
Listed below are Total Revenue, Total Discounts, and Total Discount %. Below is a breakdown of the Discounts, along with the Gross and Net revenue listed for both Rated Values and Actual Value.
Also, the Receipt Count, Percentage, Gross Discount Amount, and Net Discount Amount are listed for Receipt Discount Amounts.
Finally, you may export either report via PDF or Excel by selecting one from the top of the screen.


