
The Commodity Group Statistic is a visual report that illustrates the distribution of the total sales of commodity groups. This can be helpful in determining what groups are your most popular and least popular sellers.
The Commodity Group Statistic may be found under the Evaluations tab. If you cannot locate it there, you may need to Edit Menu Entries.
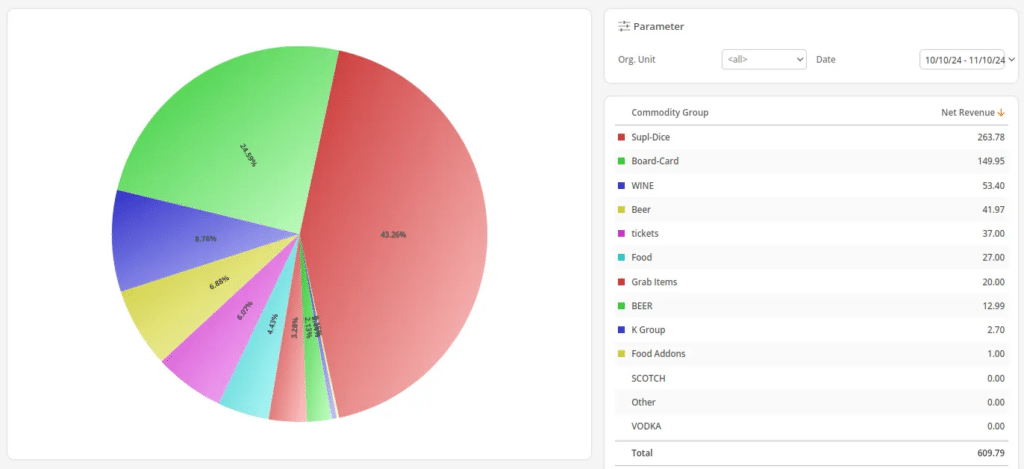
The available Filter options for this report are Org. Unit and Date range. Once you have made the desired selections, click Update to refresh the results.
On the left, a pie chart and the percentage distribution will appear. On the right side, you can see the corresponding legend with the exact sales data. You may select a color from the pie chart to be highlighted on the list, making it easier to locate sales. A Total accumulation of net revenue is also listed below.
Important Note
Graph reports may not be exported.