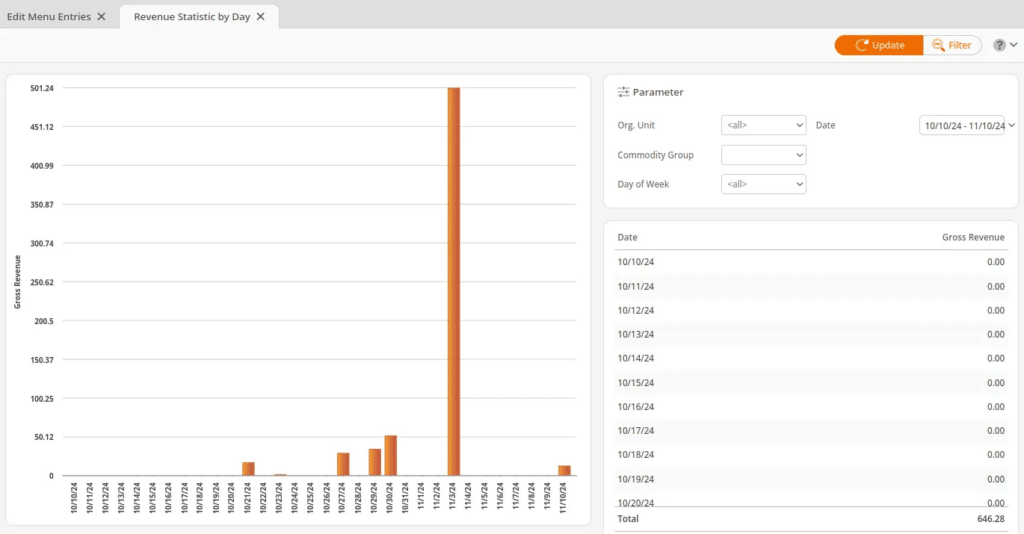
The Revenue Statistic by Day report is a visual display that shows sales per day and illustrates sales over a selected period.
The line diagram on the left shows the gross revenue of the individual days. On the right side, you can see the corresponding legend with the exact turnover data for each day or hour.
This report is found under the Evaluations tab. If this report does not appear there, please visit Edit Menu Entries to learn how to customize this section.
The Revenue Statistic by Day report can be filtered by Org unit, Commodity Group, Day of Week, and Date. Select the proper Filters and click on the Update Button at the top of the screen.
On the right, the report will be listed by Date, and Gross Revenue at the bottom of the report should have a Total.
On the left, the report is shown as a bar Graph with the Gross Revenue reflected on the left-hand side and dates reflected on the bottom. Clicking one of the bars within the graph will highlight the corresponding information on the right.