The Stock Return Rates report visually shows the percentages of products that are being returned to suppliers and, therefore, are not able to be sold. It compares sales to return rates and presents it as a graph so that you can see easily if a product is consistently faulty or even worse, returned more than sold.
Stock return rates may be found under the Evaluations tab. If you can not locate them there, you will need to Edit Menu Entries.
Choose an Organizational Unit to run the report.
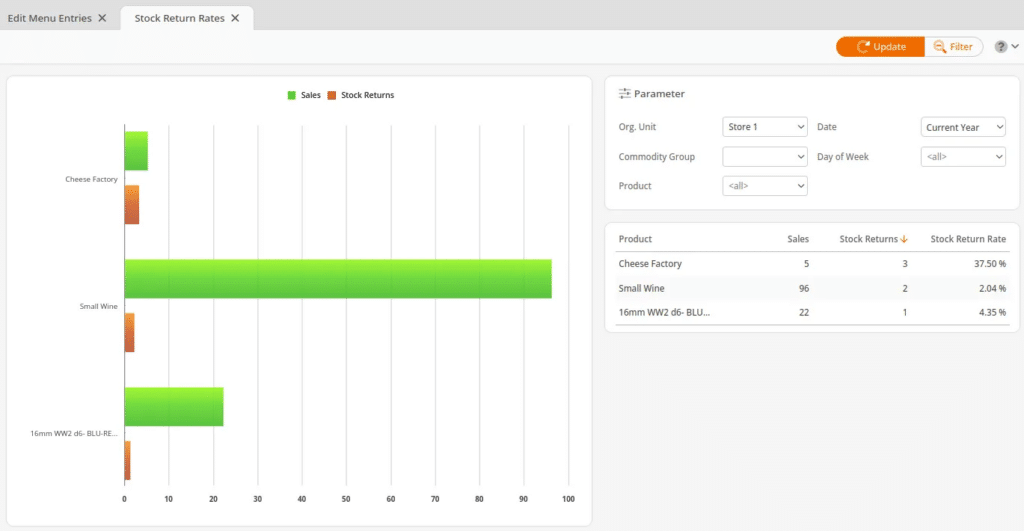
You may choose a Commodity Group, Product, and Day of the Week, or you may leave the defaults set to <all>. Once you have made your selections, click Update. This report should be listed on the right-hand side and displayed in a bar graph format on the left-hand side.
The information displayed is as follows: Product, Sales, Stock Return (count), and Stock Return Rate (%).
Important Note
Graph reports may not be exported.