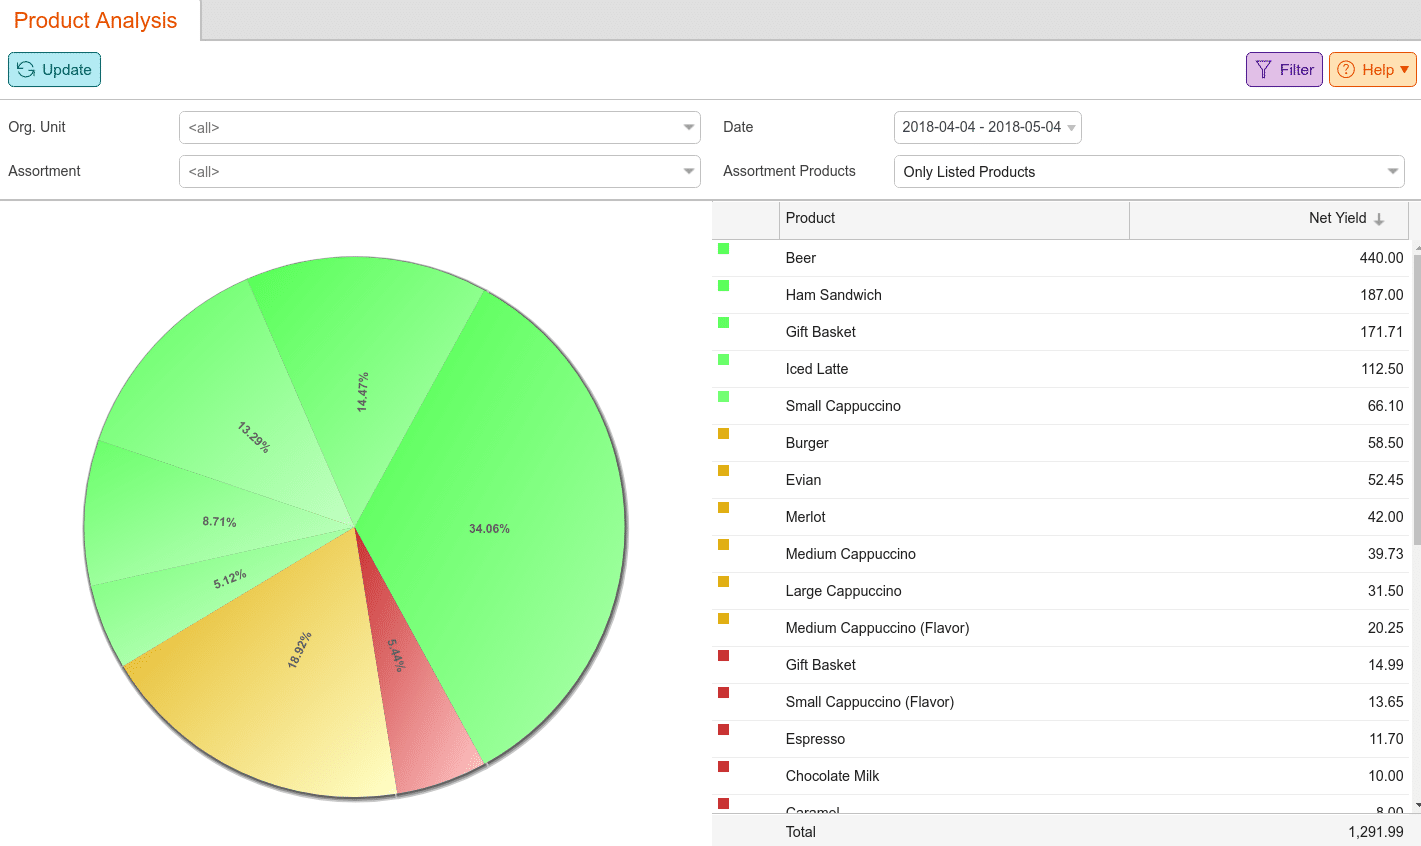
The Product Analysis statistic gives you a detailed comparison of net profits for each product. All included products are categorized into three general groups: Category A (displayed in green) Category B (displayed in orange) and Category C (displayed in red)
The Product Analysis statistic is found in the Evaluations tab. If you cannot locate it there, you must Edit Menu Entries.
If you click on a specific Product in the list using the right mouse button, the statistic will offer additional report options to analyze the product revenue even further.