
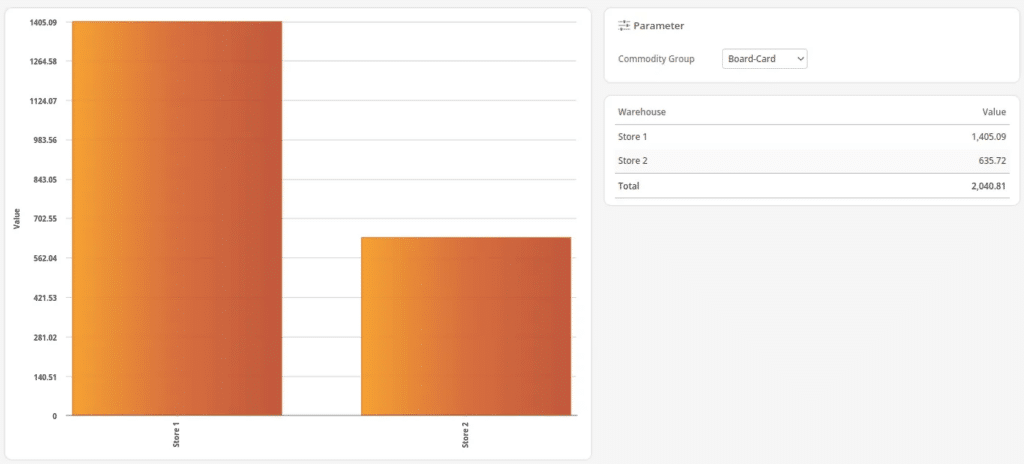
The Warehouse Statistic is a graphic that shows the total value of goods in each particular warehouse per commodity group.
This report may be found under the Evaluations tab. If you can not locate it there, you must Edit Menu Entries. Select the desired Commodity Group, and click Update to refresh the results.
The left-hand side shows a bar graph, and the right shows the warehouse names and the total value of goods in each, as well as a sum total. If a warehouse is in the negative, you will see the bar graph reflect the orange coloring onto the warehouse name.
You may click on a bar within the graph to highlight the corresponding information on the list to the right.
Note
Graph reports may not be exported.