
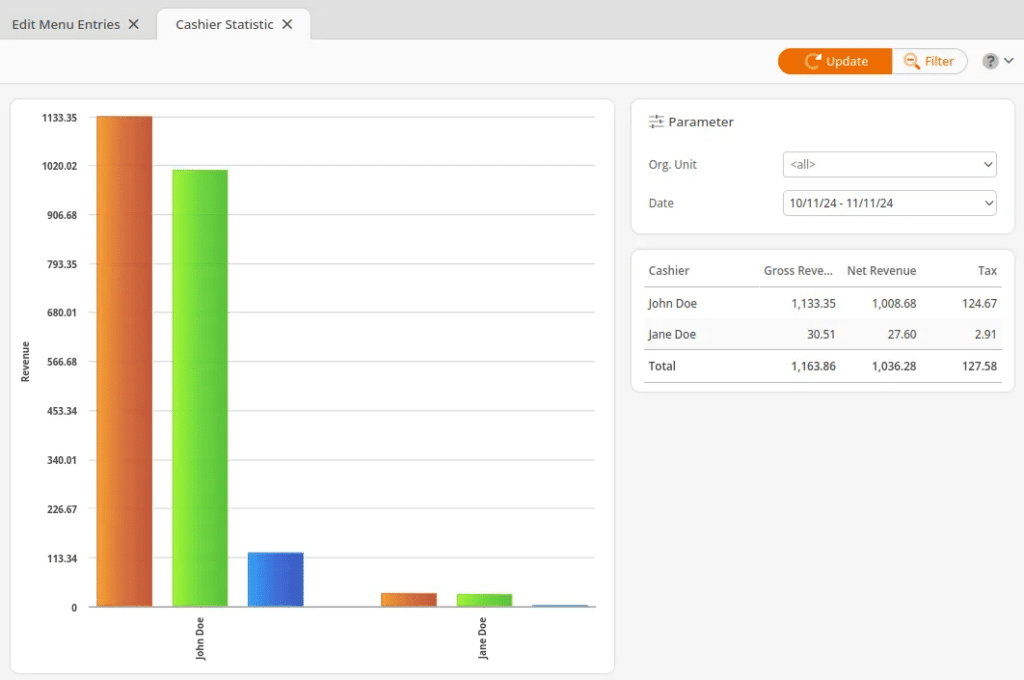
This statistic shows you a bar graph of your different cashiers and how much revenue they have brought in for the specified time period.
It is separated by the Organizational Unit and shows three separate bars for each cashier. These bars represent:
- Net Item Revenue (orange)
- Net Receipt Revenue (green)
- Tax (blue)
The Cashier Statistic report may be found under your Evaluations tab. If you cannot locate it there, you must Edit Menu Entries.
This report may be filtered by Organizational Unit and Date. Once you have made your selections, click Update to refresh the results.
Note
Bar graphs may not be exported.