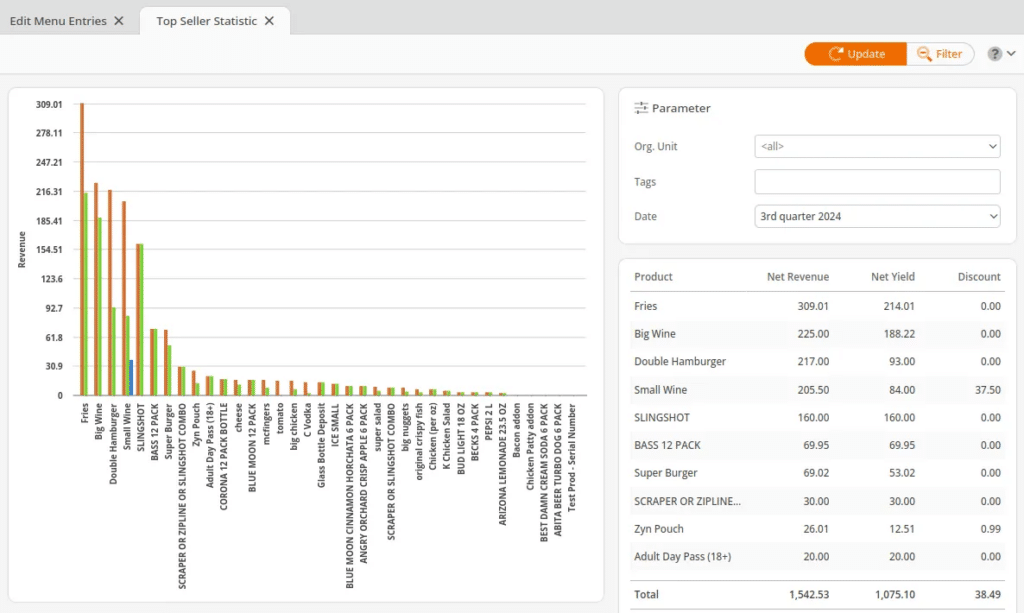
The Top Seller Statistic is similar to the Top Seller Report but with a more visual approach.  The product list is sorted by net revenue.

If you would like to see a similar statistic with a focus on profit or customers, use the most popular statistic.
The Top Seller Statistic is found in the Evaluations tab. If you cannot locate it there, you must Edit Menu Entries.
Once on the page, you may Filter by Org. Unit, Tags, and Date. Once you have made the desired selections, click Update to refresh the results.
Product(s), along with their Net Revenue, Net Yield, and Discounts, are listed on the right and reflected in a bar graph on the left.

Note
Graph reports may not be exported.


