Compares profits between two different time periods in an organizational unit. This can be useful when analyzing situations such as last year's holiday sales compared to this year's, for example.
This report can be located under the Evaluations tab. If you cannot locate it there, you must Edit Menu Entries.
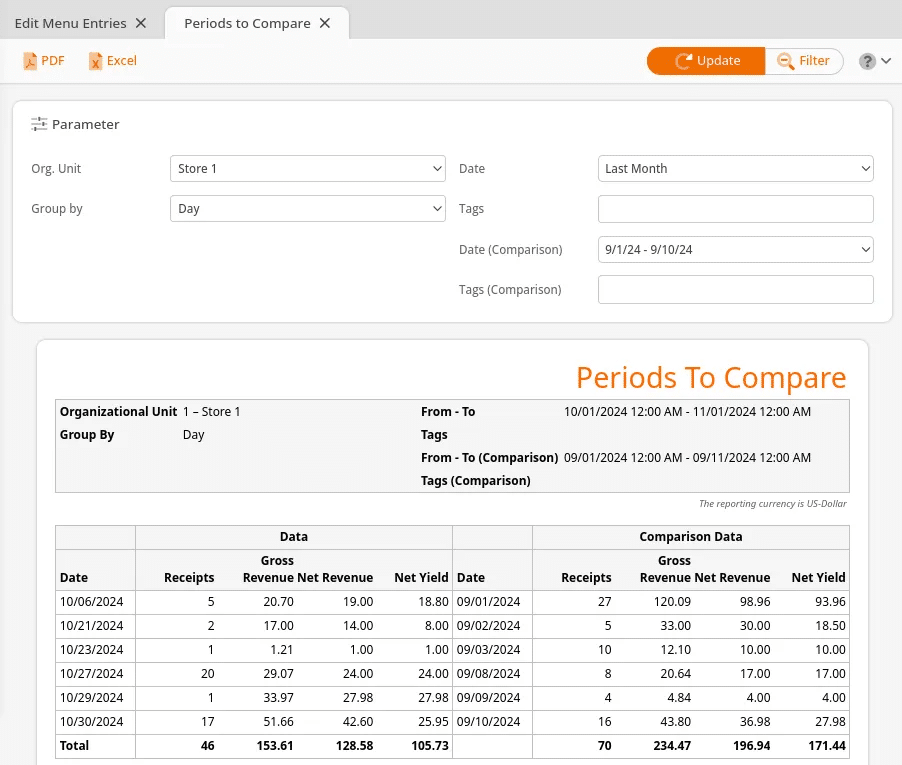
You may filter this report by Organizational Unit, Date, Date (Comparison), Tags, and Tag (Comparison). You may also Group by Day or Product. Once you have made the desired selections, click Update at the top of the page.
If you sort this report by day, you will see a total receipt amount and corresponding revenue amount but not the individual products associated with the sale.
If you sort by product, you can interact with the product names in orange coloring. These names may be selected for additional menu options:
- Edit Product
- Discount Reasons
- Product Report
- Products per Weekday
- Receipts
- Stock History
- Stock Return Rates
The report should also list Quantity Sold, Gross Revenue, Net Revenue, and Net Yield for all products for both time periods.
Finally, you may export this report via PDF or Excel simply by selecting one from the top of the screen.