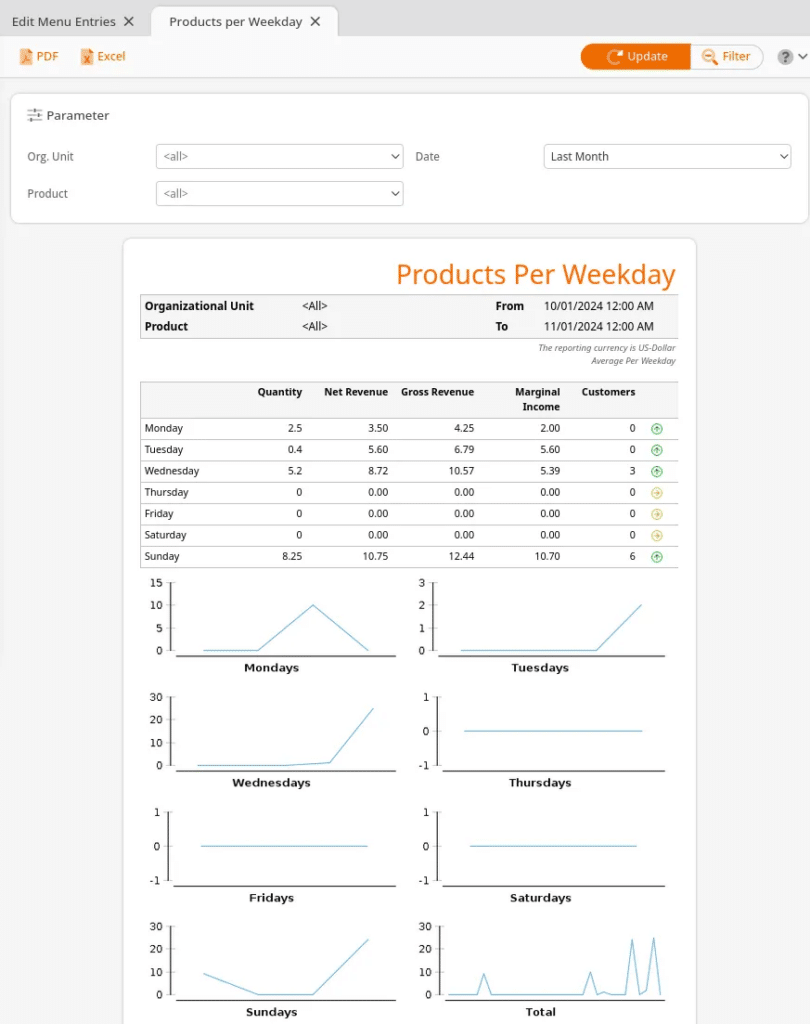
The Products per Weekday report provides a quick insight into the number of products sold per day of the week. This can help determine which days are the busiest, which can help immensely with scheduling staff. You will get a graph generated for each day and an overview of the week.
The Products per Weekday report can be found by navigating to the Evaluations tab. If you do not see your report there, please refer to our Edit Menu Options manual page.
This report can be filtered by Organization Unit, Product, and date and time. In addition, the statistics show Net Revenue, Gross Revenue, Marginal Income, and the number of Customers for each day.
All of this is displayed as a blue line graph for enhanced visual representation. Also, a colored arrow next to the “Customers“ column will indicate whether the number of products sold for that day was average, below average, or above average.
Finally, you may export this report via PDF or Excel by choosing one from the top of the page.