
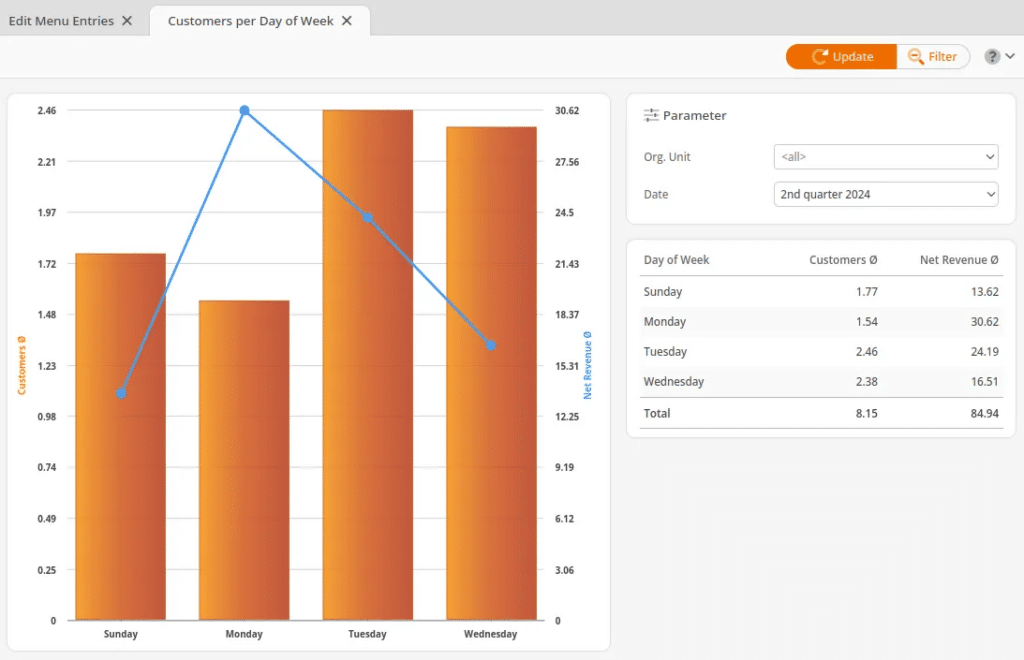
Customers per Day of Week provides quick insight into how many receipts were finalized for each day of the week in a given time frame. The report is based on completed receipts and assumes one receipt is representative of one customer.
The Customers per Day of Week Report is found in the Evaluations tab. If you cannot locate it there, you must Edit Menu Entries.
This report may be filtered by Org Unit and Date. Once you have made the proper selections, click Update to refresh the results.
The statistic shows net revenue, displayed as a blue line. The data is sorted by day, intended to help store managers decide how many staff members are required for each day of the week.
On the left, the customers for each day are represented by a bar graph with the net revenue as a line graph within. Clicking any of the columns within the graph will highlight the corresponding day of the week on the list to your right.
On this list is a Customer average and a Net Revenue average. A Total for Net Revenue is listed at the bottom of the report.
Note
Graph reports may not be exported.