
The Product Performance report can be helpful for viewing accumulated revenue for a specific product. You will get a visual representation of costs, profits, and discounts.
To view your Product Performance report, please navigate to your evaluations tab. If you do not see your report there, you will need to edit menu entries. Please refer to our Edit Menu Entries manual page.
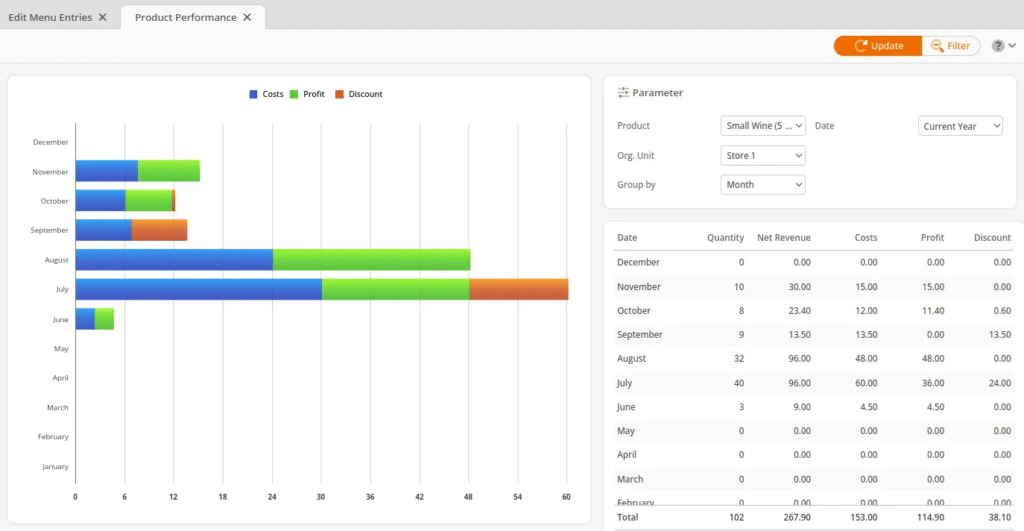
This report can be filtered by Product, Organizational Unit, and Date range and grouped by Day, Week, or Month.
Once you have made your selection, click Update. On the left-hand side of the report, you will see a list of dates the product was purchased, the Quantity sold, Net revenue, Costs, Profit, and Discounts.
On the right-hand side, this list is reflected in a bar graph:
- Costs are shown in blue
- Profit is shown as green
- Discounts will be displayed in orange
Hovering the mouse over these bars will show a $ amount.
Important Note
Graph reports cannot be exported.